


In-Depth: Packet Loss Burstiness
1 Introduction
It is generally understood that packet loss distribution in IP networks is “bursty” however there is less certainty concerning the use of specific loss models, and in fact some misunderstanding related to some commonly used models, for example the Gilbert Model. This paper outlines some key packet loss models, provides some analysis of packet loss data, discusses the degree of “fit” of models and data and proposes the use of a 4-state Markov model to represent loss distribution.
2 Common Packet Loss Models
2.1 Historical background
Much of the early work on loss or error modeling occurred in the 1960’s in relation to the distribution of bit errors on telephone channels. One approach used was a Markov or multi-state model. Gilbert [13] appears to be the first to describe a burst error model of this type, later extended by Elliott [10,11] and Cain and Simpson [6]. Blank and Trafton [3] produced higher state Markov models to represent error distributions. Another approach was to identify the statistical distribution of gaps. Mertz [17] used hyperbolic distributions and Berger and Mandelbrot [2] used Pareto distributions to model inter-error gaps. Lewis and Cox [16] found that in measured error distributions there was strong positive correlation between adjacent gaps. Packet loss modelling in IP networks seems to have followed a similar course, although the root cause of loss (typically congestion) may be different to that of bit errors (typically circuit noise or jitter).
2.2 Bernoulli or Independent Model
The most widely used model is a simple independent loss channel, in which a packet is lost (or bit error occurs) with a probability Pe. For some large number of packets N then the expected number of lost packets is N.Pe. The loss probability can be estimated by counting the number of lost packets and dividing this by the total number of packets transmitted.
2.3 Gilbert and Gilbert-Elliott Models
The most widely known burst model is the Gilbert Model [13] and a variant known as the Gilbert-Elliott Model [10,11]. These are both two state models that transition between a “good” or gap state 0 and a “bad” or burst state 1 according to state transition probabilities P01 and P11:-
(i) Gilbert Model a. State 0 is a zero loss/error state b. State 1 is a lossy state with independent loss probability Pe1 (ii) Gilbert-Elliott Model a. State 0 is a low loss state with independent loss probability Pe0 b. State 1 is a lossy state with independent loss probability Pe1
It is often assumed that the Gilbert Model lossy state corresponds to a “loss” state, i.e. that the probability of packet loss in state 1 is 1, however this is incorrect (it would be more proper to describe this as a 2-state Markov model). This leads to analysis of packet loss burstiness in terms solely of consecutive loss which misses the effects of longer periods of high loss density. As illustrated in [14], these long periods of high loss density can have significant effect on Voice over IP services.
For example, consider the following
Loss pattern 000001100101010110110000000000000000000 Correct application of Gilbert Model – burst length 15, burst density 60% Incorrect application of Gilbert Model – mean burst length 1.5 bits
2.4 Markov Models
A Markov model is a general multi-state model in which a system switches between states i and j with some transition probability p(i, j). A 2-state Markov model has some merit in that it is able to capture very short term dependencies between lost packets, i.e. consecutive losses [1, 4, 15,19]. These are generally very short duration events (say 1-3 packets in length) but occasional link failures can result in very long loss sequences extending to tens of seconds [5]. By combining the 2-state model with a Gilbert-Elliott model it is possible to capture both very short duration consecutive loss events and longer lower density events.
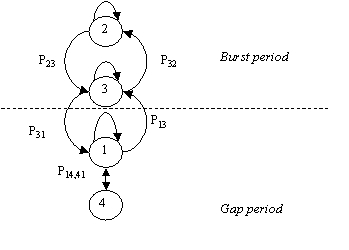 |
| Figure 1. 4-State Markov Model |
This 4-state Markov model [7, 12] represents burst periods, during which packets are received and lost according to a first 2-state model and gap periods during which packets are received and lost according to a second 2-state model.
The states have the following definition:
- State 1 – packet received successfully
- State 2 – packet received within a burst
- State 3 – packet lost within a burst
- State 4 – isolated packet lost within a gap
For example, using the loss pattern above:
Loss pattern 000001100101010110110000000000000000000000001000000000 State 111113322323232332331111111111111111111111114111111111
It is common to define a gap state with respect to some criteria, for example a loss rate lower than some limit or some consecutive number of received packets. A convenient definition is that a burst must be a longest sequence beginning and ending with a loss during which the number of consecutive received packets is less than some value Gmin (a suitable value for Gmin for use with Voice over IP services would be 16 whereas for use with Video services a higher value of say 64 or 128 would be preferable).
3 Analysis of Packet Traces
3.1 Trace descriptions
The attached traces are part of a set totaling over 3 million packets obtained from researchers at the Columbia University, University of Massachussetts, Indian Institute of Technology and Telchemy. They are one way traces obtained between different sites in the US, Europe and Asia using UDP/RTP with inter-packet intervals ranging from 10mS to 30mS. Most traces include one way delay and packet loss data, whereas some include only packet loss data.
|
| Figure 2. Example trace used in analysis |
To illustrate the nature of the data, the above chart shows an example section of a delay trace. The chart shows a congestion event and also a series of regular minor events (probably due to LAN congestion). As can be seen, associated with congestion over a routed connection there is an overall increase in delay, as well as an increase in packet-to-packet delay variation.
3.2 Trace Analysis
A series of traces were analyzed using the 4-State Markov model described above and the results interpreted as a Gilbert-Elliott model. This results in the definition of Bursts with some given length and (high) loss density and Gaps with some given length and (low) loss density. These were plotted as scatter diagrams of burst length against burst weight for each trace. The examples shown below show consistent results to that seen on many of the traces.
3.3 Trace 1
There are two charts associated with Trace W1. The first chart shows a scatter diagram of burst length versus burst weight. It can be clearly seen that burst of up to 300 packets in length occur, and have a typical loss density of 25%. There are several isolated points on the 45 degree line, corresponding to a number of long bursts of consecutive loss probably due to link failures [5].
 |
| Figure 3. Trace W1 Scatter diagram of Burst Length vs Weight for packet loss only |
The second chart shows a scatter diagram of burst length versus burst weight for losses and discards, assuming a 30mS jitter buffer size. This shows a very similar distribution to the loss-only chart, indicating that jitter was not a significant problem on this trace.
 |
| Figure 4. Trace W1 Scatter diagram of Burst Length vs Weight for combined packet loss and packet discard (30mS jitter buffer) |
3.4 Trace 3
There are two charts associated with Trace 3. The first chart shows a scatter diagram of burst length versus burst weight (Gilbert model). It can be clearly seen that burst of up to 100 packets in length occur, and have a typical loss density of 20-25%.
 |
| Figure 4. Trace W3 Scatter diagram of Burst Length vs Weight for packet loss only |
The second chart shows a scatter diagram of burst length versus burst weight for losses and discards, assuming a 50mS jitter buffer size. This shows a much larger number of bursts indicating that jitter was a significant problem on this trace. Burst density extends out to 500 packets and mean burst density is approximately 30%.
 |
| Figure 5. Trace W3 Scatter diagram of Burst Length vs Weight for packet loss and packet discard (50mS jitter buffer) |
4. Impact
Bursty packet loss has a severe impact on Voice over IP call quality. Even if the average packet loss rate for a call is low (say one percent), the lost packets are likely to occur during short dense periods, resulting in short periods of degraded quality.
5. Summary
This page provided an in-depth introduction to packet loss distribution and showed clearly that both packet loss and packet discard are bursty in nature, and that bursts are typically "sparse" rather than consecutive. Typical bursts have densities of 20-30% and lengths of several seconds. Consecutive loss can occur however this type of loss event is less common.
References
- Altman, E., Avrachenkov, K., Barakat, C., TCP in the Presence of Bursty Losses, Performance Evaluation 42 (2000) 129-147
- Berger J. M., Mandelbrot B. A New Model for Error Clustering in Telephone Circuits. IBM J R&D July 1963
- Blank H. A, Trafton P. J., A Markov Error Channel Model, Proc Nat Telecomm Conference 1973
- Bolot J. C., Vega Garcia A. The case for FEC based error control for packet audio in the Internet, ACM Multimedia Systems 1997
- Boutremans C., Iannaccone G., Diot C., Impact of Link Failures on VoIP Performance, Sprint Labs technical report IC/2002/015
- Cain J. B., Simpson R. S., The Distribution of Burst Lengths on a Gilbert Channel, IEEE Trans IT-15 Sept 1969
- Clark A., Modeling the Effects of Burst Packet Loss and Recency on Subjective Voice Quality, IPtel 2001 Workshop
- Drajic D., Vucetic B., Evaluation of Hybrid Error Control Systems, IEE Proc F. Vol 131,2 April 1984
- Ebert J-P., Willig A., A Gilbert-Elliott Model and the Efficient Use in Packet Level Simulation. TKN Technical Report 99-002 [10] Elliott E. O., Estimates of Error Rates for Codes on Burst Noise Channels. BSTJ 42, Sept 1963
- Elliott E. O. A Model of the Switched Telephone Network for Data Communications, BSTJ 44, Jan 1965
- ETSI TIPHON TS 101 329-5 Annex E, QoS Measurements for Voice over IP
- Gilbert E. N. Capacity of a Burst Noise Channel, BSTJ September 1960
- ITU-T SG12 D.139: “Study of the relationship between instantaneous and overall subjective speech quality for time-varying quality speech sequences”, France Telecom
- Jiang W., Schulzrinne H., Modeling of Packet Loss and Delay and their effect on Real Time Multimedia Service Quality, NOSSDAV 2000
- Lewis P, Cox D., A Statistical Analysis of Telephone Circuit Error Data. IEEE Trans COM-14 1966
- Mertz P., Statistics of Hyperbolic Error Distributions in Data Transmission, IRE Trans CS-9, Dec 1961
- Sanneck H., Carle G., A Framework Model for Packet Loss Metrics Based on Loss Runlengths. Proc ACM MMCN Jan 2000
- Yajnik M., Moon S., Kurose J., Towsley D., Measuring and Modelling of the Temporal Dependence in Packet Loss, UMASS CMPSCI Tech Report #98-78
- ITU SG12 D.22 A framework for setting packet loss objectives for VoIP, AT&T October 2001
Conditions of use: The material on this site is copyright VoIP Troubleshooter LLC and may be freely used but not copied or downloaded. In making use of this site the user acknowledges that VoIP Troubleshooter LLC or Contributor has no liability for any issues or problems that may arise directly or indirectly as a result of such use. VoIP Troubleshooter LLC and Contributor are providing this material as-is with no warranty as to correctness or completeness and do not accept any responsibility for any issues or problems of any nature whatsoever that may arise from the use of the material on this site.